your companyAre You Ready - Evaluation Is Complete
Review your ROI Below for
Your overall score!:
Oops...looks like it didn't work!
Here is your answer:
Ooops something went wrong
.png)
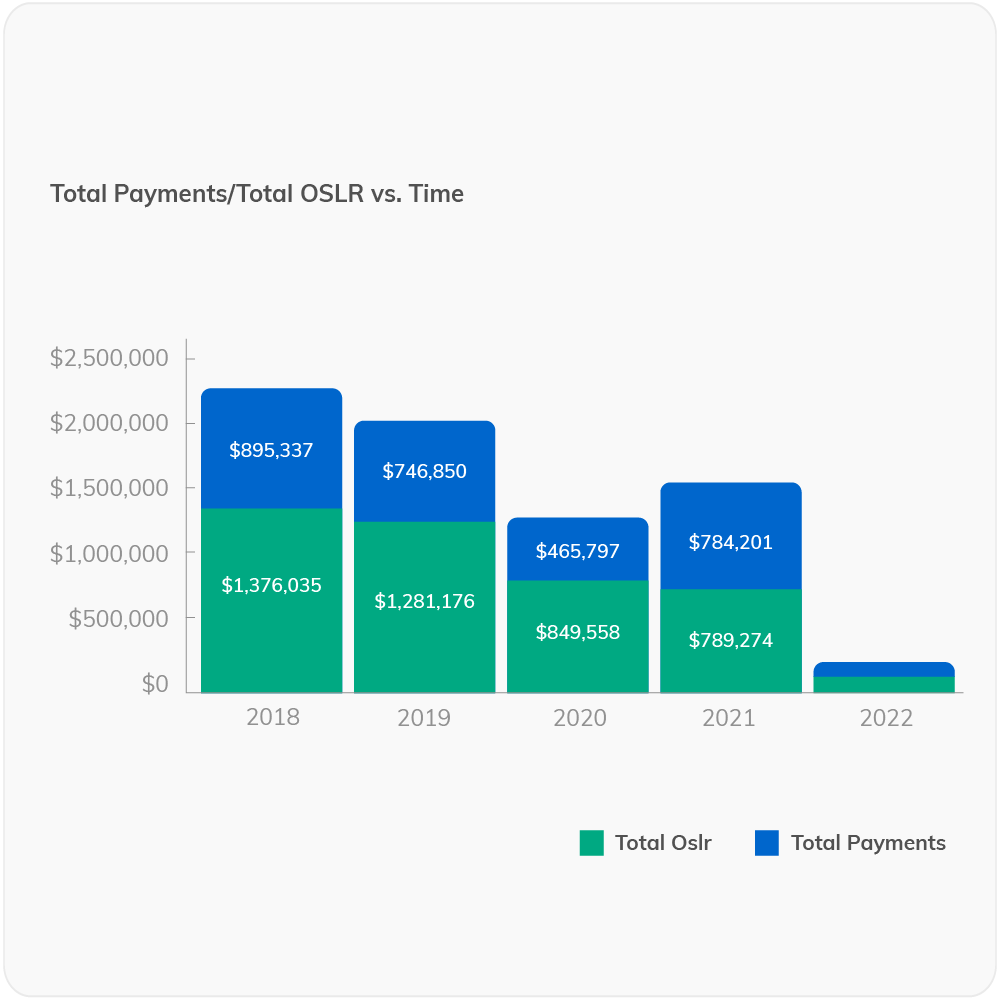
Total Payments / Total OSLR vs. Time
Monitor your incurred claim cost over time and balance paid versus OSLR to understand your performance and exposure historically.
Tracking how the cost of your claims has trended over time is the first metric you’ll be able to point depict a more active approach to risk management. As you measure over time, you’ll be able to understand how much of your claims cost for a given year is already paid vs. reserved to determine where your costs are more finalized and where you still have the opportunity to manage and monitor costs.
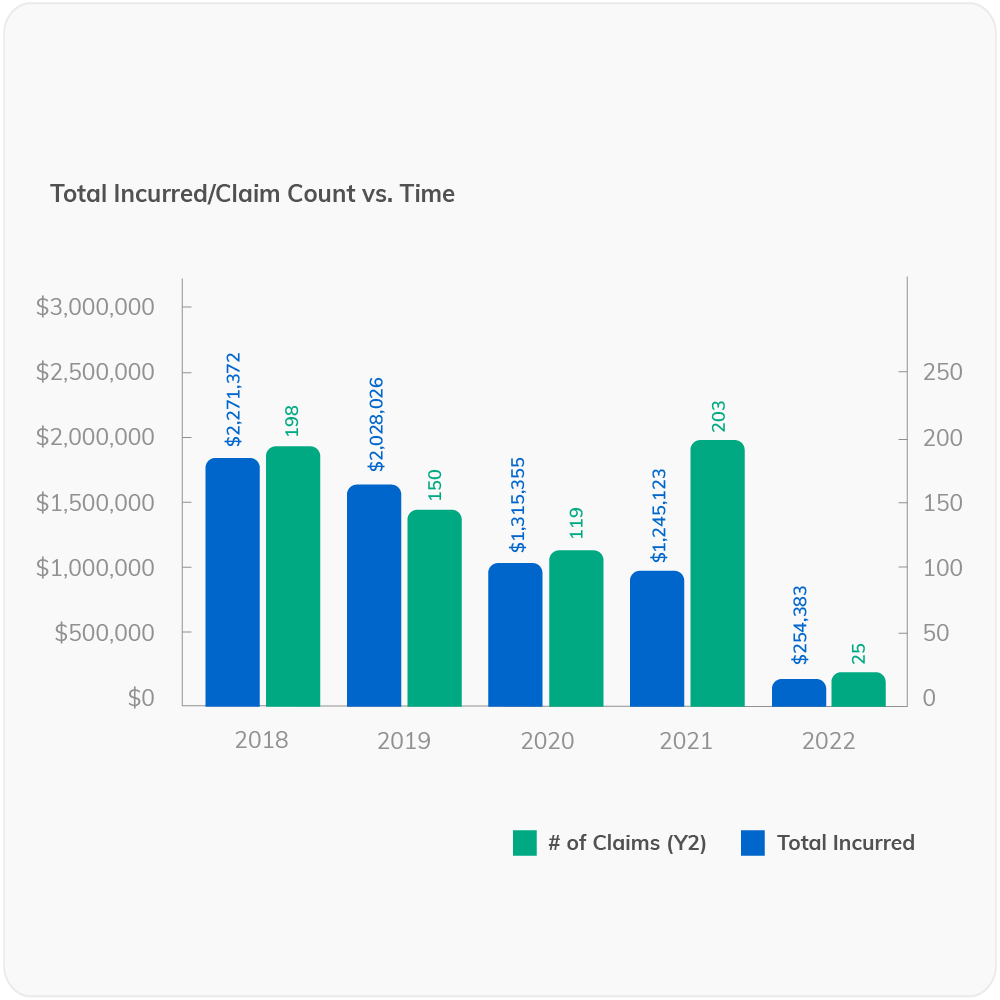
Total Incurred / Claim Count vs. Time
Show management side by side progress on claim frequency and severity.
As a risk manager, your positive impact will result in both a reduction in frequency and severity of claims. Track those side by side over the year to help showcase how your organization is trending across both key metrics and safety initiatives.
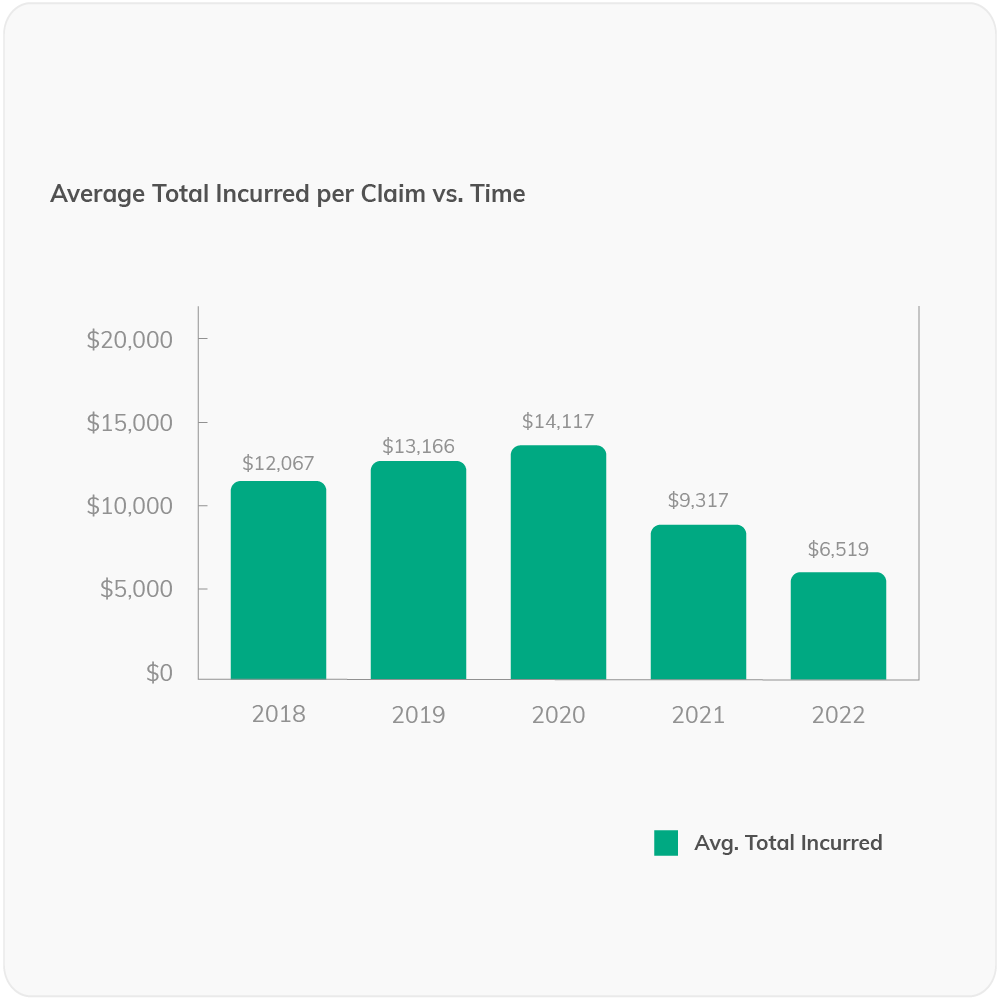
Average Total Incurred per Claim vs. Time
Show how your safety improvements are impacting claim severity and cost over time.
How do you show that your claim case severity is improving? One industry indication is the average cost per claim. Improvements like technology or process improvements may be hard to measure individually, but looking at the overall cost per claim can show how your team has improved their response efficiency and driven down the average cost per claim overtime.
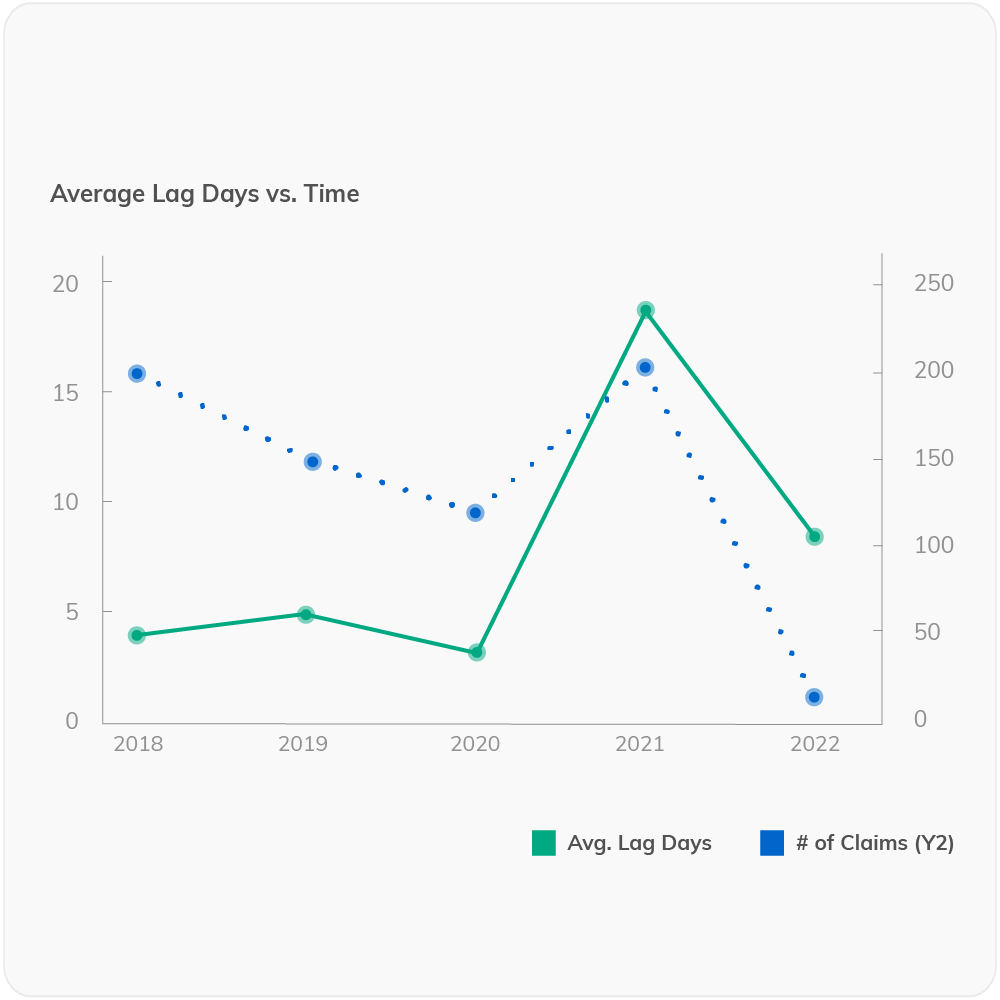
Average Lag Days
vs. Time
Put your response time to the test, and see if your risk management team is increasing their responsiveness and efficiency.
Many risk teams struggle to convey to their organizations the importance of immediate incident reporting. Oftentimes, the incidents that get missed and drive up lag time increase the risk of severity, and the chance of litigation. Monitoring your team's ability to improve its responsiveness can help you showcase improvements in the first step of the claim reporting process and set your team up for successful claim mitigation and triage.
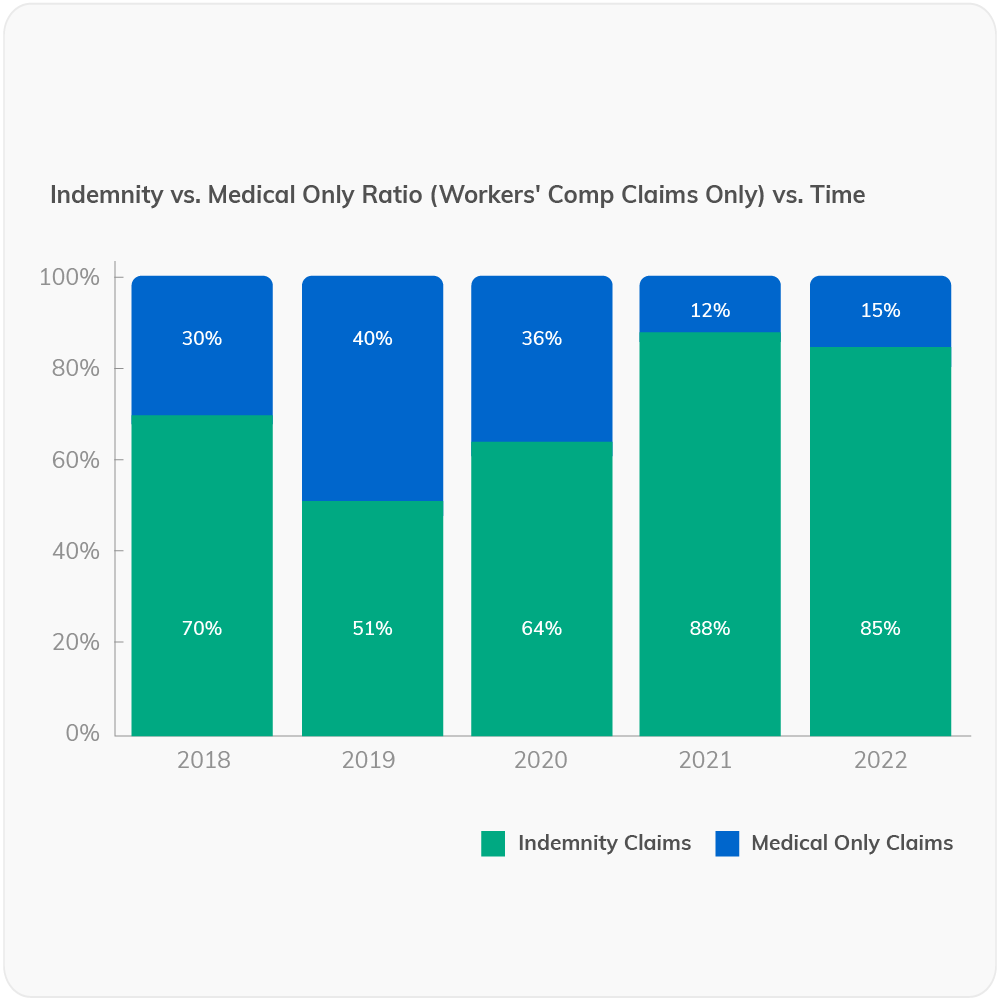
Indemnity vs. Medical Only Ratio vs. Time
Promote your risk team’s precision by tracking their ability to drive down the percentage of claims that move from medical-only to indemnity.
Experienced risk professionals know that indemnity claims are more expensive than medical-only claims. An Active Risk Management approach can improve things like response rate, triage, better prevention and mitigation that reduce the percentage of claims that move from medical-only to indemnity. Fewer indemnity claims mean lower average claim costs and faster resolution times.
Note: Workers' comp claims only
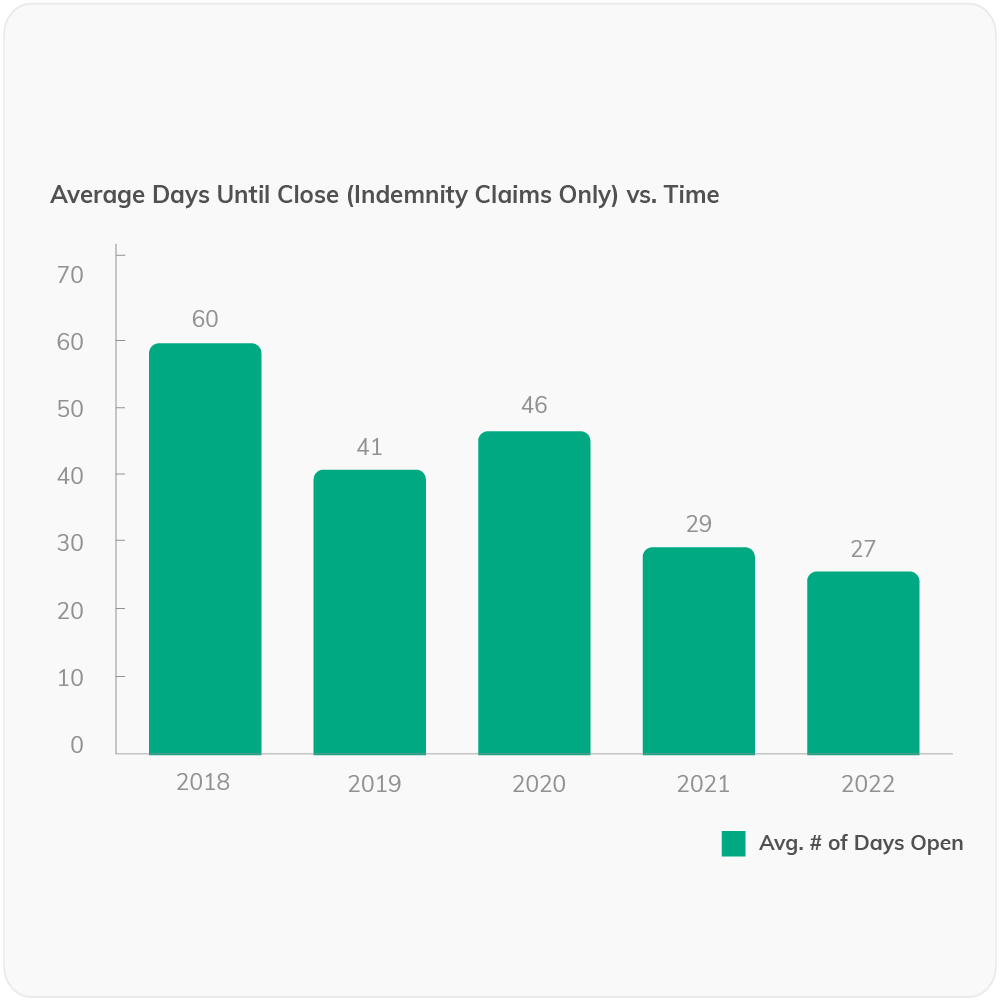
Average Days Until Close (Indemnity Claims Only) vs. Time
Track your efforts and productivity in driving down the complexity of your indemnity claims, which tend to be more expensive and last longer than medical-only claims.
Indemnity claims typically involve employees who miss work. These claims tend to involve more complexity, last longer and involve an employee who has missed some work. Actively managing these claims and utilizing a robust return to work program can result in faster closure of indemnity claims. Isolating results on these claims can help to showcase the results of your efforts to combat indemnity claim costs.
Note: Indemnity Claims Only
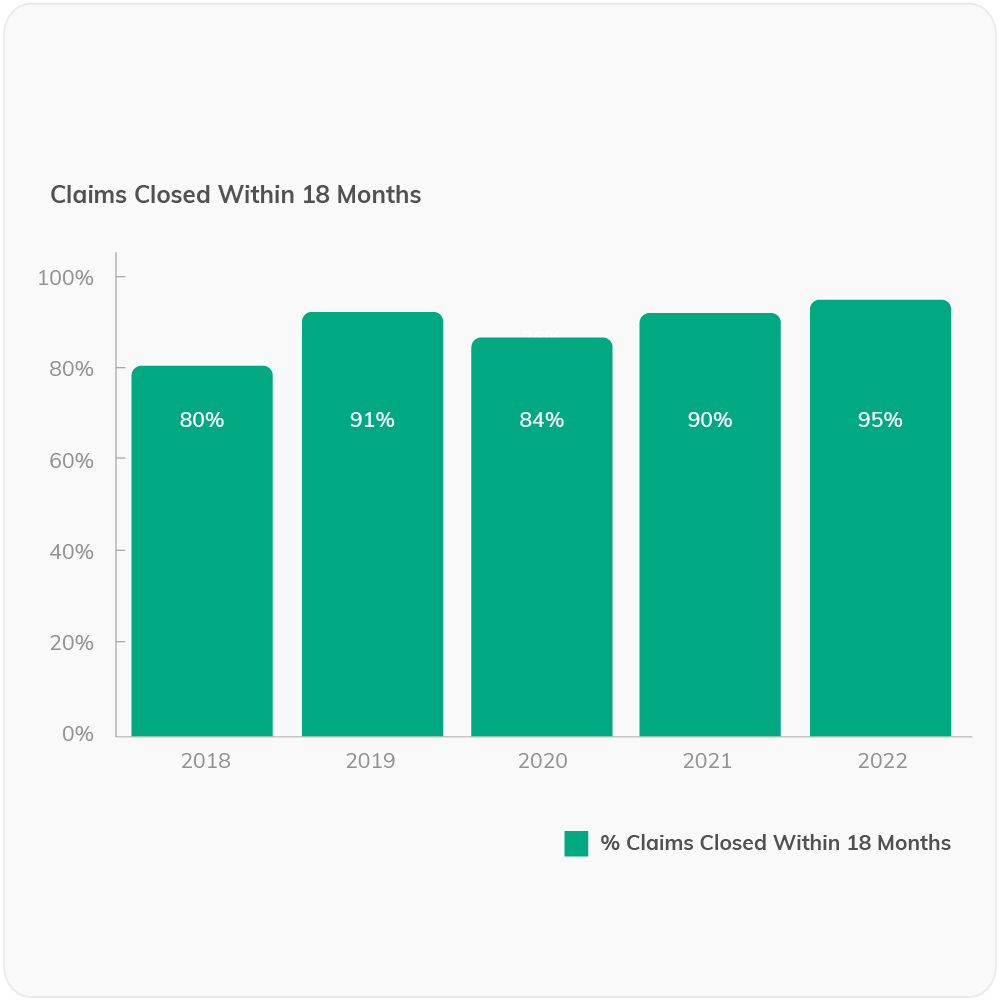
Claims Closed Within 18 Months
Track your risk team's ability to get claims closed faster, resolving open issues through more proactive management.
Experienced risk professionals know that indemnity claims are more expensive than medical-only claims. An Active Risk Management approach can improve things like response rate, triage, better prevention and mitigation that reduce the percentage of claims that move from medical-only to indemnity. Fewer indemnity claims mean lower average claim costs and faster resolution times.
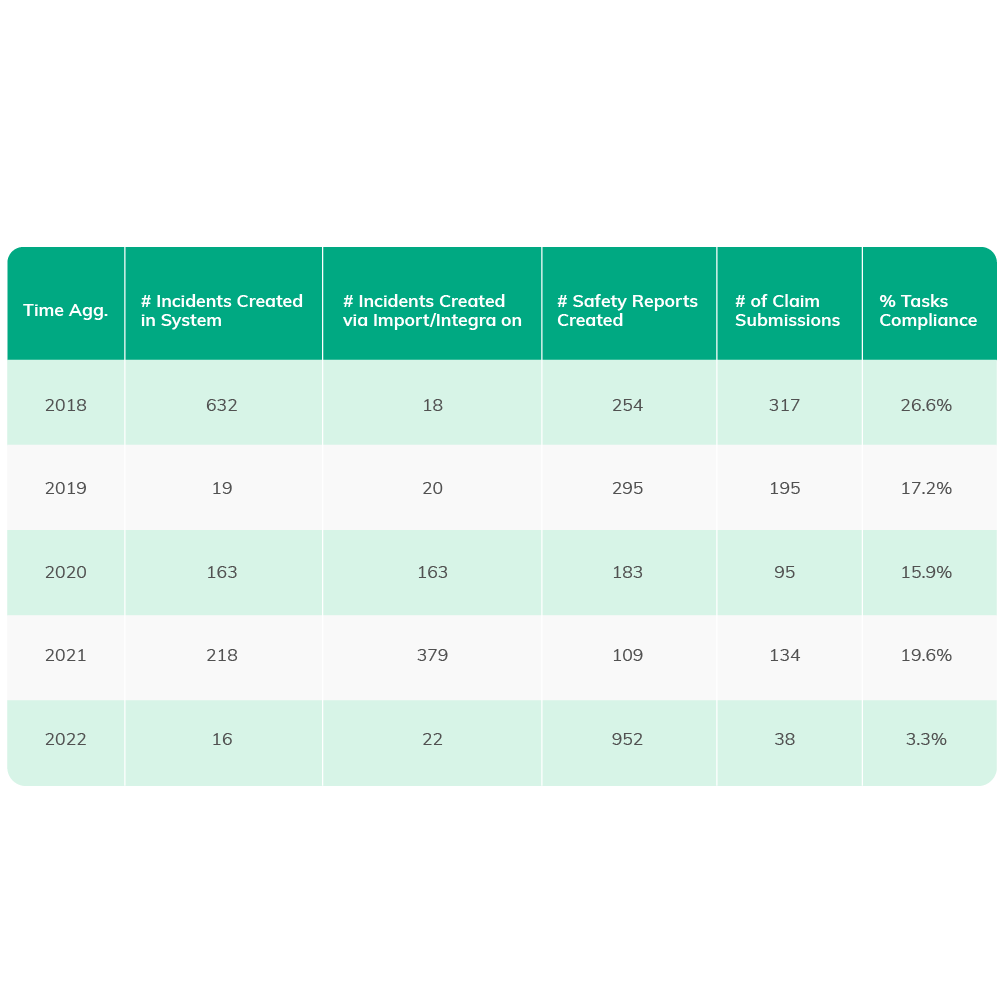
Aclaimant Activity vs. Time
Showcase your risk management team’s effort and efficiency.
Productivity has never been an exact science, and most risk management tools don’t even have a way to indicate the efficiency of your risk management team. Now you can show management the processing power or your risk managers. Help to highlight how many activities your team has completed, changes over time, and provide insight into how much work your team completes on a day-to-day basis with in-depth insight.
Get all of the right information, every time.
Companies using Aclaimant reduce administrative burden by 12 hours for every claim.

RISK MANAGEMENT CONVERTED TO PROFIT
Everything starts with how you capture the most critical information, and what you do with that information. Aclaimant's CFO dashboards empower your team to show their effectiveness.
When you are able to clearly show how you're minimizing costs, every dollar you put in your risk program works harder. Turn your passive risk management into profitable risk management.
To use the CFO Dashboard, customers must have incident and claims data, complete loss runs data (including close dates & dollars), and standard Aclaimant workflow set-up (this excludes legacy customer set-ups with workflows not compatible with the CFO dashboard). Please reach out to customer.success@aclaimant.com for clarification.

Company
Product
Resources
Privacy Policy Security Terms Responsible Disclosure Help Center
© 2021 Aclaimant 330 N. Wabash, 23rd Floor, Chicago, IL (312) 361-3477
